Facility operations platform
Move work from reactive to planned. And prove it.
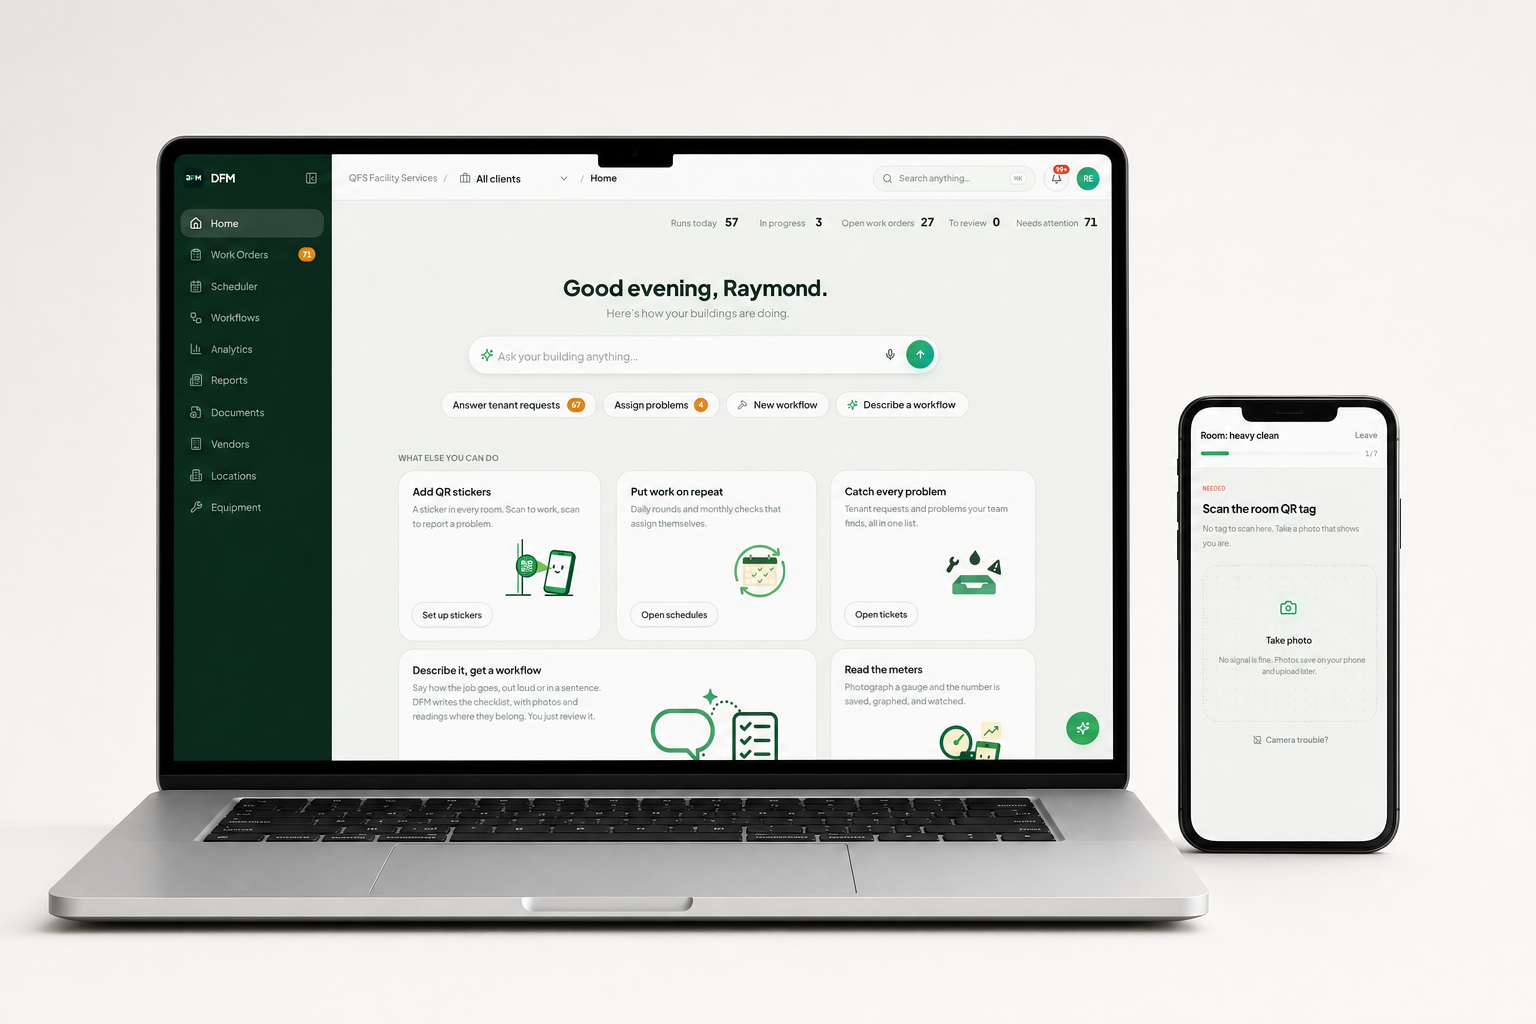
DFM consolidates work orders, inspections, preventive maintenance, assets and vendors into one operating record. Facility leaders use it to hold down cost per square foot, defend a capital plan, and answer an auditor in minutes.
Thirty minutes, built on one of your own procedures.
The real screens, with real data in them.
- ControlOperating cost
- ReduceCompliance risk
- ProveWhat was delivered
Facility teams who moved their record onto DFM
The DFM platform
One operating record,
instead of four systems.
Most estates run a CMMS, a separate inspection application, a vendor portal and a spreadsheet, joined by hand. The joins are where the cost and the risk sit, and they are the reason quarterly reporting takes a week to produce.
Work order management
SLA measured from the work rather than estimated, with cost attributable to the site and the asset.
Inspections and compliance
Statutory and internal programmes with evidence retrievable by unit and date, and findings tracked to closure.
Asset and equipment history
Service history and condition readings per asset, which is what a repair-or-replace case needs behind it.
Vendor management
Attendance and delivery verified independently of the invoice, with insurance currency tracked.
Analytics and reporting
Work mix, PM compliance, SLA attainment and repeat failures, calculated from completed work.
Field execution
Works with no connectivity in twelve languages, which is why the completion data comes back complete.
By industry
The economics differ by sector
A hospital is judged on survey outcomes, a retail estate on downtime and standard drift, a campus on its deferred maintenance backlog. Each page names what that sector is actually measured on.





The gap worth closing
The work mix
is the budget
Facility cost is driven less by the rates you negotiate once a year than by how much of the work is unplanned, which is decided every week. This is the distance between the middle of the market and the top of it.
- 3 to 5x
- Cost of a reactive repair against the same work planned
- 91%
- Top-quartile PM compliance rate
- Above 80%
- Planned work ratio held by top performers
- Under $2.50
- Top-quartile cost per square foot per year
Figures are published industry benchmarks from IFMA and BOMA operating-cost surveys, not DFM customer results.
When surveyors came for the Joint Commission audits, they saw our system in action and were impressed about how easily we could produce proof of inspections. DFM was instrumental in us getting our Joint Commission accreditation.

Resources
Written for the person who has to change something
Long-form guides on the programmes that carry the most cost and risk, short pieces on why implementations stall, and the inspection procedures themselves. No form to fill in first.



See it on one of your own procedures
Send us a round you run today. We will build it before the call and show it executing on a phone, with your own reporting behind it.